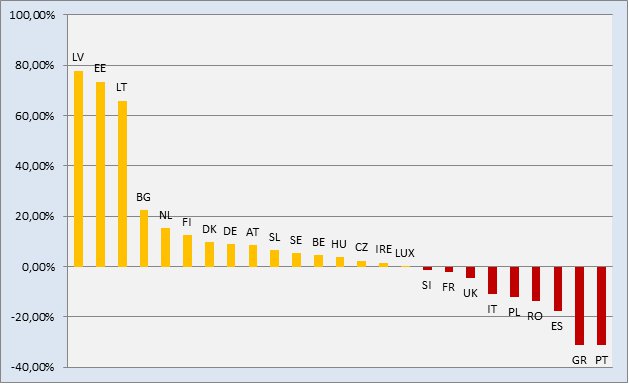
The new passenger cars registrations in the European Union are decreasing with 1,7%.
Winners and loosers can be seen at our graphic.
All Baltic countries have the biggest raising in registered new passenger cars. For example, in 2011 in Latvia was registered less than 5 cars per 1000 inhabitants new passenger cars (with increase rate 78%), while in Germany almost 40 new cars per 1000 inhabitants (increase rate 9%), in Greece 9 (increase rate -31 %) new passenger cars per 1000 inhabitants was registered.
Portugal, Greece and Spain has lost the most compared with the other countries which is coincident to the general economic situation.
| Jan – Dec | Jan – Dec | % Chg | |
| ’11 | ’10 | 11/10 | |
| AUSTRIA | 356.145 | 328.563 | +8,4 |
| BELGIUM | 572.211 | 547.347 | +4,5 |
| BULGARIA | 19.136 | 15.646 | +22,3 |
| CZECH REPUBLIC | 173.282 | 169.236 | +2,4 |
| DENMARK | 168.707 | 153.858 | +9,7 |
| ESTONIA | 15.350 | 8.848 | +73,5 |
| FINLAND | 126.123 | 111.989 | +12,6 |
| FRANCE | 2.204.229 | 2.251.669 | -2,1 |
| GERMANY | 3.173.634 | 2.916.260 | +8,8 |
| GREECE | 97.682 | 141.499 | -31,0 |
| HUNGARY | 45.097 | 43.479 | +3,7 |
| IRELAND | 89.896 | 88.446 | +1,6 |
| ITALY | 1.748.143 | 1.961.579 | -10,9 |
| LATVIA | 8.849 | 4.976 | +77,8 |
| LITHUANIA | 13.223 | 7.970 | +65,9 |
| LUXEMBURG | 49.881 | 49.726 | +0,3 |
| NETHERLANDS | 556.123 | 482.544 | +15,2 |
| POLAND | 277.430 | 315.858 | -12,2 |
| PORTUGAL | 153.433 | 223.464 | -31,3 |
| ROMANIA | 81.719 | 94.541 | -13,6 |
| SLOVAKIA | 68.203 | 64.033 | +6,5 |
| SLOVENIA | 58.417 | 59.226 | -1,4 |
| SPAIN | 808.059 | 982.015 | -17,7 |
| SWEDEN | 304.984 | 289.684 | +5,3 |
| UNITED KINGDOM | 1.941.253 | 2.030.846 | -4,4 |
| EUROPEAN UNION (EU27)* | 13.111.209 | 13.343.302 | -1,7 |
| EU15 | 12.350.503 | 12.559.489 | -1,7 |
| EU10* | 760.706 | 783.813 | -2,9 |
| ICELAND | 5.038 | 3.106 | +62,2 |
| NORWAY | 138.345 | 127.754 | +8,3 |
| SWITZERLAND | 318.958 | 294.239 | +8,4 |
| EFTA | 462.341 | 425.099 | +8,8 |
| EU27*+EFTA | 13.573.550 | 13.768.401 | -1,4 |
| EU15+EFTA | 12.812.844 | 12.984.588 | -1,3 |


